2023.11.25 Hyundai Motor Company
Hydrogen Inside 1
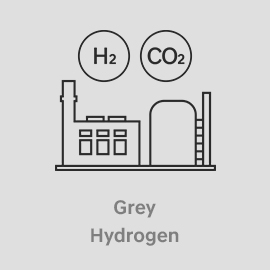
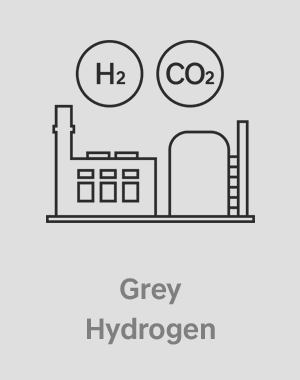
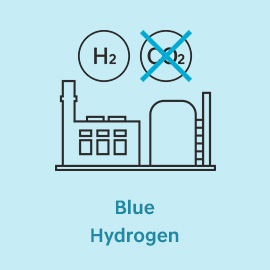
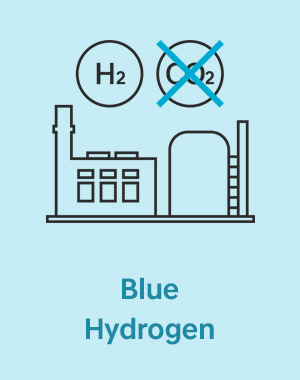
Hydrogen can be classified into 3 categories based on production methods: grey hydrogen, blue hydrogen, and green hydrogen. Gray hydrogen is obtained from fossil fuels such as petroleum or natural gas, and it generates CO2 during the production process. Blue hydrogen is produced by capturing and storing the CO2 generated during gray hydrogen production, thus minimizing carbon emissions. Green hydrogen is produced by utilizing electricity obtained from renewable energy sources and electrolysis(a process involving the reaction between water and electricity to yield hydrogen) technology.
There are various methods of green hydrogen production. Among them, let's focus on the commonly known one, which is green hydrogen, produced using renewable energy.

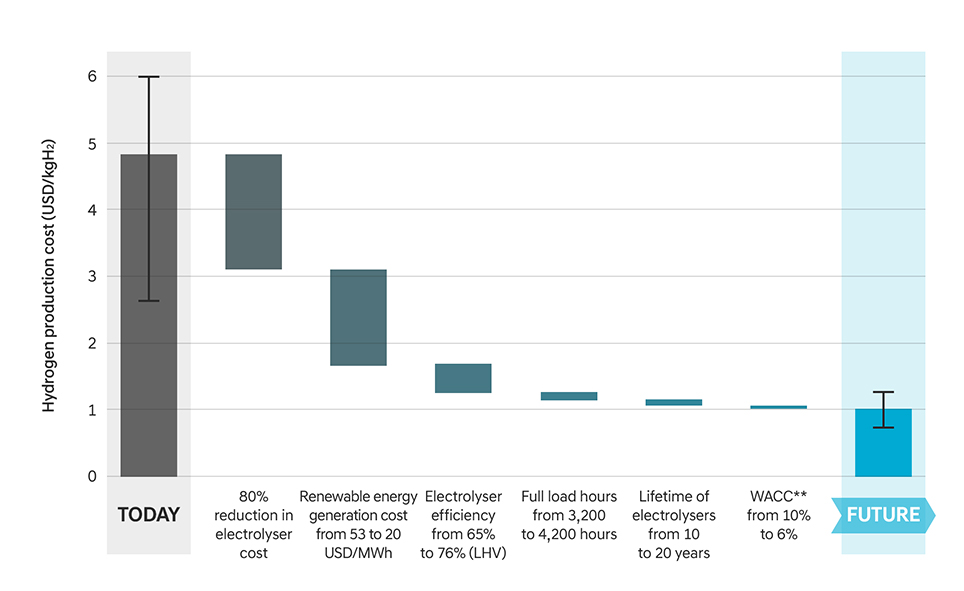
To enable the commercialization of green hydrogen, it is necessary to lower its production cost to achieve price competitiveness. Figure 1 shows various factors that can help to lower the production cost of green hydrogen, highlighting that electrolysis costs and renewable energy generation costs have the most significant impact. As renewable energy generation technologies progress, leading to decreased renewable energy generation costs, and with the development of electrolysis equipment to enhance cost efficiency, economically feasible green hydrogen production can be achieved.
* Full load hour :
It refers to the actual operating time of the equipment, excluding any periods of downtime.
With a year consisting of 8,760 hours, “3,200→ 4,200 hours” means that the capacity utilization rate has increased from 36% to about 48%.
** WACC (Weighted Average Cost of Capital) :
It represents the factor applied when converting future cash flows into their present value.
To identify the annual hydrogen production cost (annual cost/annual hydrogen production amount), it is necessary to define the amount of expenses invested each year.
However, equipment investment is concentrated during the initial stages of the project and does not occur thereafter. Hence, it is essential to reevaluate the annual equipment investment cost, which can be defined as "total equipment investment expenditures (CAPEX) x capital recovery factor (CRF)."
The mentioned capital recovery factor is proportional to WACC, and any decrease in WACC will lead to a reduction in the hydrogen production cost based on the process below.
WACC ▼ → capital recovery factor ▼ → annual equipment investment expenditures ▼ → hydrogen production cost ▼
Will it be possible for all countries to produce green hydrogen without significant price disparities after technological advancements? The answer is no.
Geographical factors also influence green hydrogen production, potentially causing imbalances in production costs among countries, even with comparable technological progress. Two primary factors contribute to this.
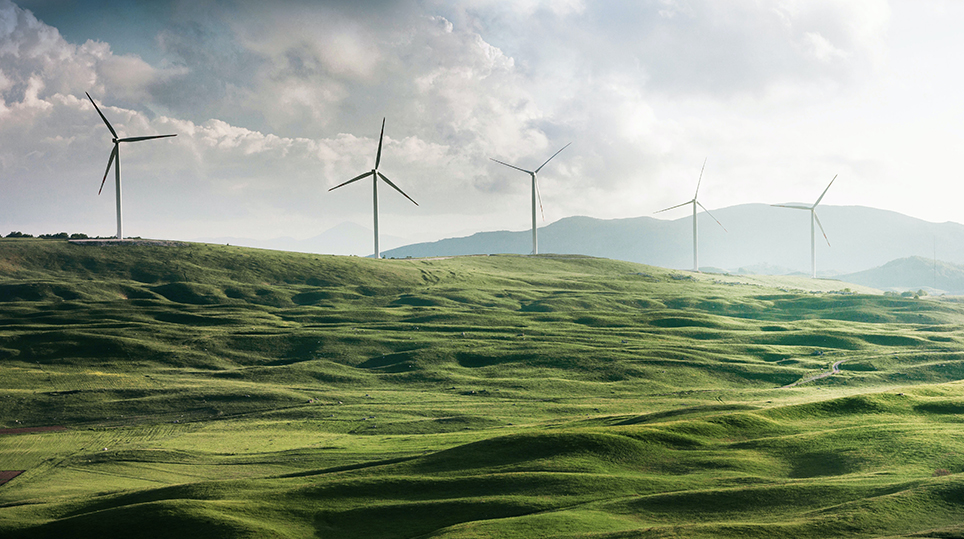
Firstly, there are disparities in the availability of renewable energy resources across countries. Saudi Arabia and Australia, for example, have relatively abundant solar energy, while Chile and the North Sea region have a huge amount of wind energy. Consequently, countries with abundant renewable energy resources have a competitive edge in green hydrogen production.
Moreover, the availability of land area varies among countries. Renewable energy plants cannot be installed on agricultural land, forests, wetlands, or protected areas. Hence, a country's geographical and environmental conditions influence its potential for green hydrogen production. Due to these two reasons, there are variations in renewable energy generation costs, which, as seen above, significantly impact the production cost of green hydrogen, leading to disparities in production costs among countries.

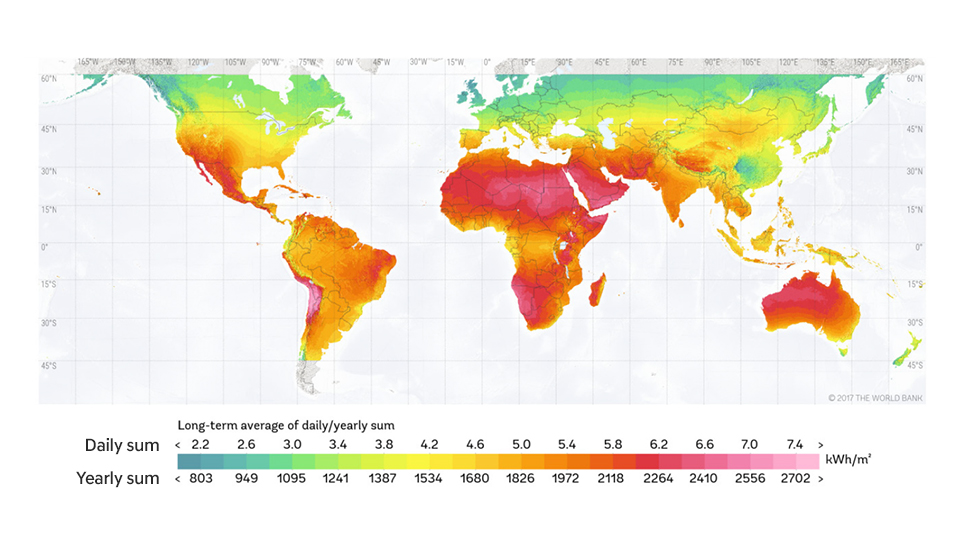
Figure 2 represents the distribution of solar energy across different nations. It shows that the Middle East, Africa, and Australia have abundant solar energy resources, while countries like Korea and Europe have relatively limited resources. Similarly, the wind energy amount varies among nations, leading to variations in the overall renewable energy capacity on a country-by-country basis.
*GHI : Global Horizontal Irradiance, the solar energy in the form of electromagnetic radiation on a horizontal surface. (Unit : power per unit area)
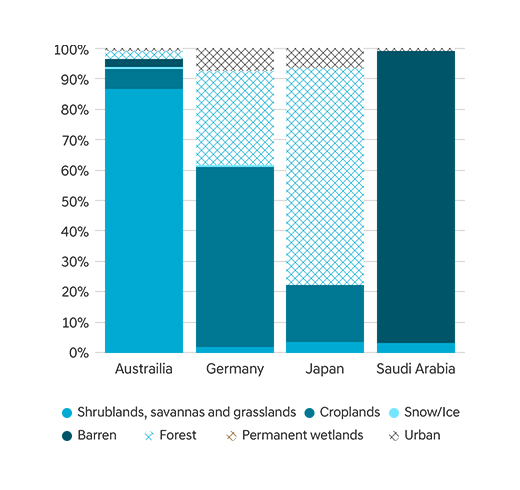

Figure 3 illustrates the composition of land types across different countries. Australia has a significant proportion of shrubland and grassland, while Saudi Arabia occupies the majority of its Barren.
In contrast, Japan and Germany have a higher proportion of agricultural land and forests. From this, we can infer that Australia and Saudi Arabia have a considerable amount of unused land, while Japan and Germany have relatively less unused land.
Therefore, from a geographical perspective, Australia and Saudi Arabia are presumed to be better places for green hydrogen production in comparison to Germany and Japan.
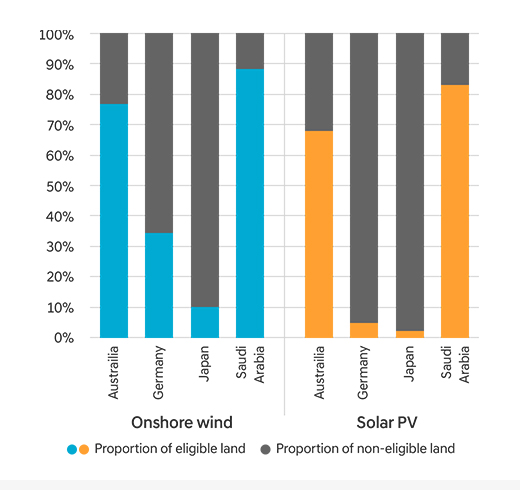
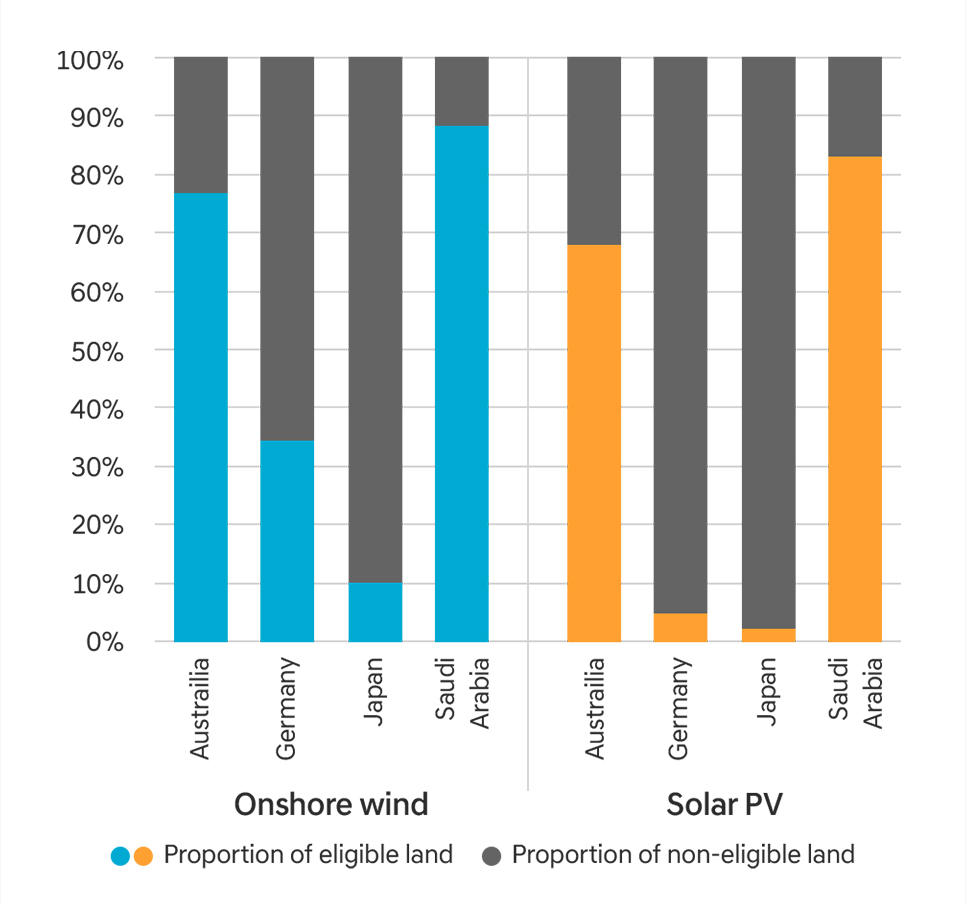
Figure 4 represents the proportion of land where it is not possible to install renewable energy generation facilities. It notably emphasizes that Germany and Japan face greater limitations in terms of available land for renewable energy generation facilities, as opposed to Australia and Saudi Arabia.
Large-scale green hydrogen production can achieve cost savings, but it requires the installation of large renewable energy generation facilities. Therefore, the amount of available land in each country would be also a crucial factor to consider.
As seen above, the production cost of green hydrogen is expected to vary by country, due to factors such as the amount of renewable energy generation capacity and geographical conditions. Figure 5 shows a global map of the levelized cost of green hydrogen in 2030 and 2050.
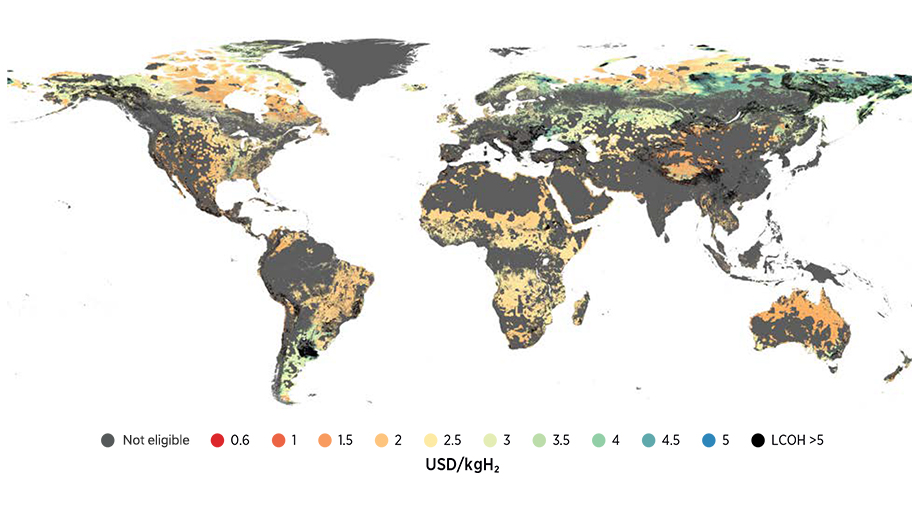
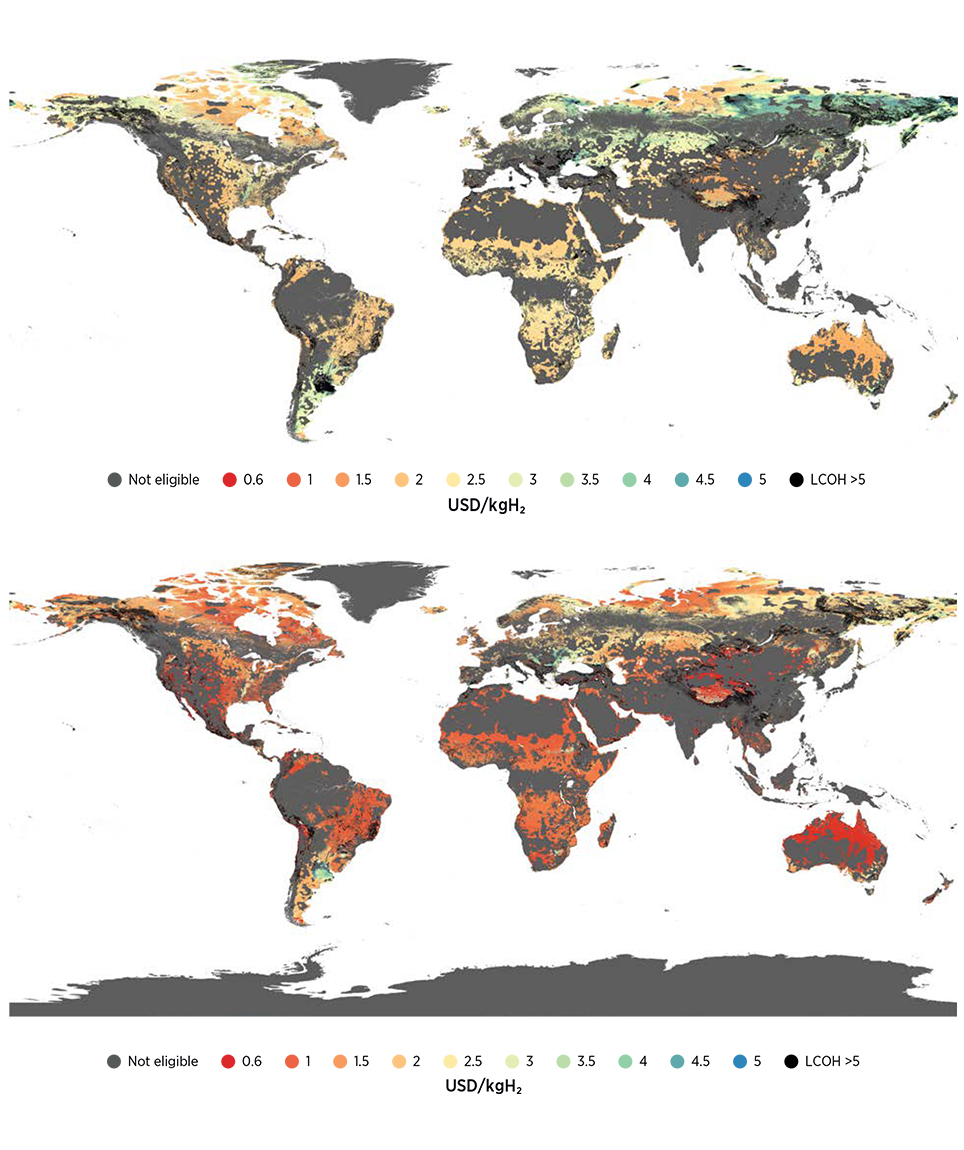
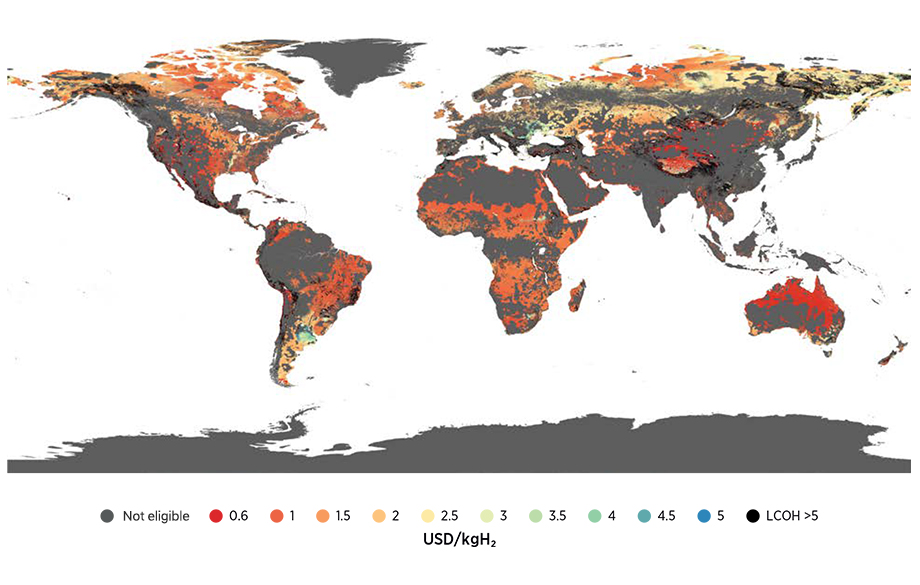
With the global development of electrolysis and renewable energy infrastructure, the levelized cost of green hydrogen production is anticipated to decrease by 2050 compared to 2030.
However, production costs would vary from country to country, and some countries may have lower competitiveness in green hydrogen production due to geographical conditions. In Korea, similar to Japan, the scarcity of land for installing renewable energy generation facilities and the limited availability of renewable energy resources are expected to result in higher green hydrogen production costs.
To promote green hydrogen utilization in Korea, it is essential to explore other approaches such as Waste-to-Energy (H2), besides relying solely on renewable energy-based green hydrogen production.
Another option is to import cost-effective green hydrogen produced abroad for domestic utilization. To facilitate this, it is important to establish collaborations with international green hydrogen projects and conduct in-depth research on hydrogen carriers. The next episode of Hydrogen Inside will look at the current status and outlook of hydrogen storage and transportation technologies.
* Waste-to-Energy (H2) :
This process involves utilizing biogas extracted from organic waste such as food scraps, livestock manure, and sewage sludge to produce hydrogen.